Home » All posts
Free Forex Signal 8/12/2006
1. Short Aud/Usd @ 0.7905 or better. Target 0.7850, 0.7780.
2. Long Usd/Jpy @ 114.80 or better. Target 115.60, 116.70.
Happy Trading. Btw I cannot be held responsible for any loss from the signal above.
In The Land Of Forex
Those are the words i hold on to in forex. No matter what happen in technical or fundamental study. Always follow the trend. Trend is king. Follow the king and you will be rewarded handsomely.
Free Forex Signal 10/11/2006
Eur/Usd is currently at 1.2862. From my calculation Eur/Usd has an upper range of 1.2880 - 1.2950. Possible trade is short Eur/Usd @ 1.2880 or better.
Gbp/Usd
Gbp/Usd is currently at 1.9102. As stated in my other blog, possible trade is short Gbp/Usd @ 1.9100 or better wih upper range of 1.9100 -1.9150
Aud/Usd
Possible trade short Aud/Usd @ 0.7710 or better. Already gone down now. Btw i shorted from 0.7751. Its a good trade so far.
Forex Trade Review
Anyway Im going to review few pairs. Maybe some of you can find a trade from my review. As for me I am currently out of the market waiting for it to come to sense. Currently all pairs are at extreme oversold or overbought.
Eur/Usd
Currently at 1.2532 after a drop of almost 200 pips. Currently its on a thin downtrend with a possible target of 1.2450. For those of you who are already on a short position, you may hold the position with trailing stop loss of your choice. For me I will only consider an entry at 1.2450, that will depend on the strength of the momentum.
Gbp/Usd
Currently at 1.8540 and just like eur/usd it drop like a rock during NFP report out. Possible target is 1.8200. Looks like a retrace coming soon. Just watch the trend and momentum for possible entry. I will be looking at this one.
Usd/Cad
Currently at 1.1330. My last signal manage to get me 30 pips. Too small for the effort. Currently going up with possible target of 1.1450. Overshot all indicators. Possible retrace at 1.1360. I will be watching this one.
This is my review. Its not a trade recommendation. Be very carefull on your trade coz forex is a risky market. If you are not sure better stay out until the market make some sense. Happy trading.

Forex Signal
usd/cad is currently at 1.1270 with a high of 1.1305. Looking at the chart, it has lost its momentum eventhough the uptrend is still intact. It may hover around 1.1240 - 1.1310 for a while.
Possible Trade:
Short usd/cad @ 1.1300 or better.
Target: 1.1180, 1.11201, 1.1080.
Caution:
If usd/cad overshoot 1.1315, then its possible that it will go long. This is because usd/cad is currently going uptrend. It will be constantly making new high.
555 Forex Trading System
Time Frame : 4 hours
MA's : SMA5 or SMA8 which ever suits you better, SMA55
TSF : Period=55
Bollinger Band : MA=simple, Period=55, Multiple=2.0
Stochastic Slow : Period = 10,3,3, simple, simple
Stochastic Fast : Period = 13,3 Exponential
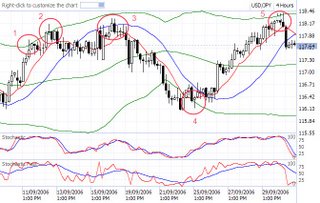 For the 1st chart I use usd/jpy pair for 4 hour timeframe. Remember this forex system is designed for 4 hour time frame but can be use on all pairs. In this forex system, MA8 (Red) and TSF55 (Blue) is the indicator for long or short trade. When the red is above blue = long and vice versa. BB55 and SMA55 is the target. Both the stochastic is for confirmation on trade position.
When price is at BB55 either at the top or bottom and both stochastic is showing extreme value, it may signal a reversal. A confirm reversal is when price broke the red and blue line. The price itself is the ultimate indicator. Once the price broke the 2 lines, find the best possible entry. Normally the best entry is when the price is at the blue line. If after you enter the trade, and the price gain momentum in your favour just let it run and ride it till its finish.
Below is the explaination for the above chart
- Price spike out of BB55. As mentioned before, BB55 acts as targets. In this case usd/jpy already reach its target based on this system but the momentum is still strong based on distance of Red and Blue line.
- Price spike out of BB55 again but this time the price close below the Red line. This indicates the momentum is dead and a reversal coming soon.
- Ideal entry. Red below Blue line indicates a short position. Price is at the Blue line. Short now and let it run until it meet BB55 at the bottom
- Price went through BB55 and then goes flat at this point. It is making its way back into BB55 and a flat Red line indicating the momentum is dead and a reversal is coming soon. At this point the entry for long position is the lowest price inside BB55.
- Price spike out of BB55 but cannot make new high. This is where I exit and enter a new short position. Let it run until the momentum is dead.
If you look at point 1,2,3 and 5. All are high point and all of them is higher than the previous high. This is and indication that usd/jpy is actually going up but as forex moves in waves we sometimes get lost and fail to see the big picture. In this case what ever you do, follow the trend and always remember that the big picture is usd/jpy is going uptrend. Be prepare if the market suddenly shoot up. Remember always use stop loss properly. Forex is a risky market, do manage your risk properly.

Catch The Dow and Elliott Waves
One of Dow's powerful concepts is the three-waves principle. Decades after Dow first wrote on the subject, R.N. Elliott took up the cause to create his unique Elliot Wave Theory. So let's combine their work, and see what these guys taught us a few dozen years before we discovered the markets were a good place to hang out.
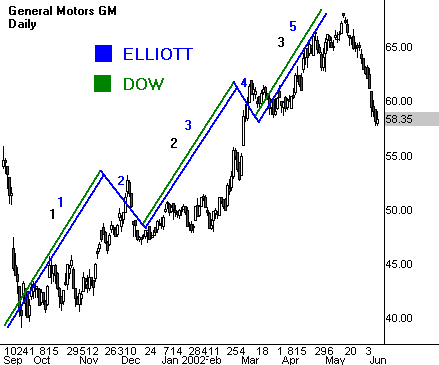
Dow's three waves were built on the concept of the primary trend. We all know what Charlie was talking about here. The primary trend is the major market direction over years or decades. This is how we determine whether we're in a bull market or a bear market. Dow determined this primary trend by looking at long-term price patterns and seeing the obvious.
Elliott used his five-wave trend to reach the same conclusions. He noted that the primary trend was composed of three waves moving in the major direction and two waves moving against it. Furthermore, each primary wave hid a smaller wave structure that exposed the true nature of price direction. For example, Elliott commented that failures exhibited a rollover of certain waves within this fractal structure and gave rise to trend reversals.
In Dow's world, a market printing higher highs and higher lows revealed a primary bull trend. Conversely, a market printing lower highs and lower lows revealed a primary bear trend. Elliott had no problem with this view, but he added a few twists of his own. For example, he pointed out how certain phases of a primary trend showed very limited counter-waves and rarely pulled back until the entire wave set was completed.
Three-wave principles get more interesting when Dow and Elliott describe characteristic crowd behavior in each of the waves. Let's examine these through a bull market cycle.
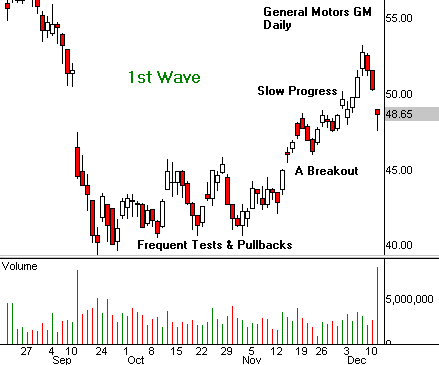
The first wave triggers value buying by patient investors who anticipate better economic conditions and long-term growth. This occurs during the same period that sentiment records its lowest readings and experts tell everyone in sight to stay away from the financial markets. Value investors wake up from this gloom and realize that the fear-filled talk hides a nascent recovery. They buy aggressively from distressed sellers and nurture a sustainable bottom.
Elliott noted that this first wave shows very gradual price improvement and turns back on itself frequently to test lower levels. He also points out that this wave takes a long time to complete and gives a true bottoming appearance to the chart. The good news is that the market eventually triggers enough momentum to carry price up to much higher levels.
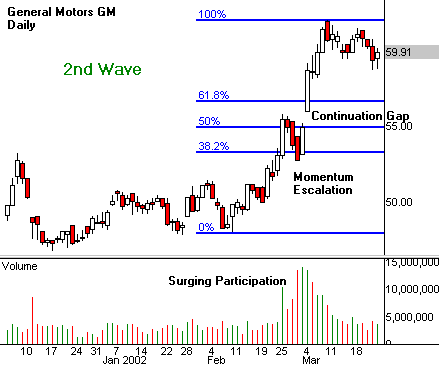
Bullish evidence begins to mount in Dow's second wave. Improved corporate earnings, increased employment and unexpected innovation characterize this midpoint of a broad bull move. Less demanding investors now enter the market because they see better times ahead and want to participate. They build good-sized portfolios and start to follow the markets with great interest.
Elliott sees this wave as the most dependable phase of the entire bull cycle. Price movement advances rapidly, with less overlap from day to day. Small gaps appear between bars as investors buy high and look to sell higher. A sharp advance often triggers right in the middle of the wave, when a burst of enthusiasm forces a wide continuation gap. This powerful move often marks the exact middle for the entire three-wave event.
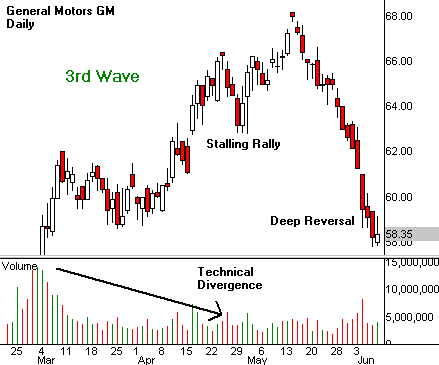
Danger signs grow during Dow's third wave, but they're hard to accept because of an outstanding market environment. Record earnings and full employment lead the media to proclaim an era in which the sky's the limit. Joe Sixpack now joins the hunt as the public forgets about its losses from the last bear cycle. This broad market participation starts a buying panic. At this very moment, the smart-money investors who bought at the bottom begin to unload their positions into the hands of the waiting public. The market eventually runs out of gas and prints a long-term top.
The last wave in Elliott's world can show a parabolic spike, or a failure move before it gets under way. This dichotomy points out the danger the public faces when it enters the stock market in force. Elliott noted that the large-scale reversal off this last wave may be very deep and painful. As we now know from personal experience, this rapid selloff addresses the many sins common to all bull cycles.
Labels
- audusd (2)
- CatFx50 (1)
- eurusd (2)
- Expert Advisors (1)
- Faizumi (2)
- Faizumi-fx (3)
- Forex Profit System (1)
- Forex Strategies (39)
- Forex System (6)
- ForexSignal30 (1)
- ForexSignals30 (1)
- free forex signal (3)
- gbpusd (3)
- Gold System (1)
- J16a (1)
- Merdekarama (2)
- moving average (1)
- Mr Snake and The Wave (1)
- Murrey Maths Trading System (1)
- Online Forex Brokers (1)
- PiNkFX (1)
- Renko Ashi Trading System 2 (1)
- rsi (1)
- Sifufx (1)
- Spoutnik (1)
- SS2009_V2 (1)
- trade of the day (2)
- Trend Indicators (1)
- Volatility Quality (VQ) (1)


