Home »Unlabelled » 555 Forex Trading System
555 Forex Trading System
Time Frame : 4 hours
MA's : SMA5 or SMA8 which ever suits you better, SMA55
TSF : Period=55
Bollinger Band : MA=simple, Period=55, Multiple=2.0
Stochastic Slow : Period = 10,3,3, simple, simple
Stochastic Fast : Period = 13,3 Exponential
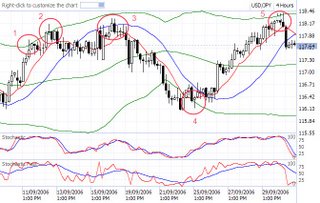
 For the 1st chart I use usd/jpy pair for 4 hour timeframe. Remember this forex system is designed for 4 hour time frame but can be use on all pairs. In this forex system, MA8 (Red) and TSF55 (Blue) is the indicator for long or short trade. When the red is above blue = long and vice versa. BB55 and SMA55 is the target. Both the stochastic is for confirmation on trade position.
When price is at BB55 either at the top or bottom and both stochastic is showing extreme value, it may signal a reversal. A confirm reversal is when price broke the red and blue line. The price itself is the ultimate indicator. Once the price broke the 2 lines, find the best possible entry. Normally the best entry is when the price is at the blue line. If after you enter the trade, and the price gain momentum in your favour just let it run and ride it till its finish.
Below is the explaination for the above chart
- Price spike out of BB55. As mentioned before, BB55 acts as targets. In this case usd/jpy already reach its target based on this system but the momentum is still strong based on distance of Red and Blue line.
- Price spike out of BB55 again but this time the price close below the Red line. This indicates the momentum is dead and a reversal coming soon.
- Ideal entry. Red below Blue line indicates a short position. Price is at the Blue line. Short now and let it run until it meet BB55 at the bottom
- Price went through BB55 and then goes flat at this point. It is making its way back into BB55 and a flat Red line indicating the momentum is dead and a reversal is coming soon. At this point the entry for long position is the lowest price inside BB55.
- Price spike out of BB55 but cannot make new high. This is where I exit and enter a new short position. Let it run until the momentum is dead.
If you look at point 1,2,3 and 5. All are high point and all of them is higher than the previous high. This is and indication that usd/jpy is actually going up but as forex moves in waves we sometimes get lost and fail to see the big picture. In this case what ever you do, follow the trend and always remember that the big picture is usd/jpy is going uptrend. Be prepare if the market suddenly shoot up. Remember always use stop loss properly. Forex is a risky market, do manage your risk properly.
Labels
- audusd (2)
- CatFx50 (1)
- eurusd (2)
- Expert Advisors (1)
- Faizumi (2)
- Faizumi-fx (3)
- Forex Profit System (1)
- Forex Strategies (39)
- Forex System (6)
- ForexSignal30 (1)
- ForexSignals30 (1)
- free forex signal (3)
- gbpusd (3)
- Gold System (1)
- J16a (1)
- Merdekarama (2)
- moving average (1)
- Mr Snake and The Wave (1)
- Murrey Maths Trading System (1)
- Online Forex Brokers (1)
- PiNkFX (1)
- Renko Ashi Trading System 2 (1)
- rsi (1)
- Sifufx (1)
- Spoutnik (1)
- SS2009_V2 (1)
- trade of the day (2)
- Trend Indicators (1)
- Volatility Quality (VQ) (1)
0 comments:
Post a Comment